WHAT IS XRF (X-RAY FLUORESCENCE SPECTROMETRY)?
X-ray fluorescence spectrometry is one of the most efficient instrumental means to detect the elemental composition of the homogeneous obsidian. It’s speed, precision for incompatible elements, ready availability, and consequent low cost make EDXRF particularly ideal for the non-destructive analysis of archaeological obsidian. It is not necessarily the best suited for the analysis of heterogeneous substances, but with recent advances in x-ray spectrometry and new software it is becoming one of the best instruments for the analysis of nearly any archaeological material.
A BRIEF INTRODUCTION TO XRF OF ARCHAEOLOGICAL OBSIDIAN
(HOW IT WORKS)
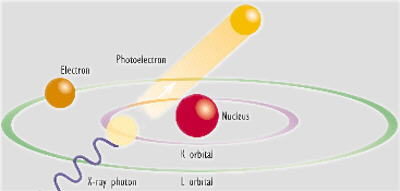
When the atoms in a sample material are irradiated with high-energy primary x-ray photons, electrons are ejected in the form of photoelectrons. This creates electron 'holes' in one or more of the orbitals, converting the atoms into ions - which are unstable.
To restore the atoms to a more stable state, the holes in inner orbitals are filled by electrons from outer orbitals. Such transitions may be accompanied by an energy emission in the form of a secondary x-ray photon - a phenomenon known as "fluorescence".
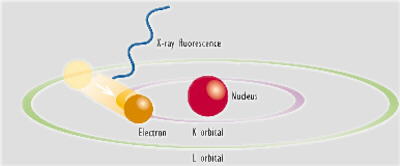
The various electron orbitals are called K, L, M, etc., where K is closest to the nucleus. Each corresponds to a different energy level - and the energy (E) of emitted fluorescent photons is determined by the difference in energies between the initial and final orbitals for the individual transitions.
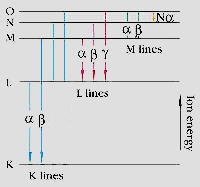 Highest energy
The amount of x-ray fluorescence is very sample dependent and quantitative analysis requires calibration with standards that are similar to the sample matrix. For obsidian analyses, North American labs use obsidian and rhyolite standards from USGS, NIST, and the Japan Geological Survey. The technique provides an elemental, not a chemical analysis. XRF is inapplicable to the first 11 elements of the periodic table. Sample penetration varies from about 0.01mm to 1mm in depth depending on the sample material. Analysis is occasionally complicated by interfering x-ray lines and by matrix effects, which are corrected in both EDXRF and WXRF by linear and quadratic algorithms.
Characteristic x-ray emissions result in an energy spectrum that is a "fingerprint" of the specimen. The intensities of the peaks in the spectrum are roughly proportional to the concentrations of the constituent elements.
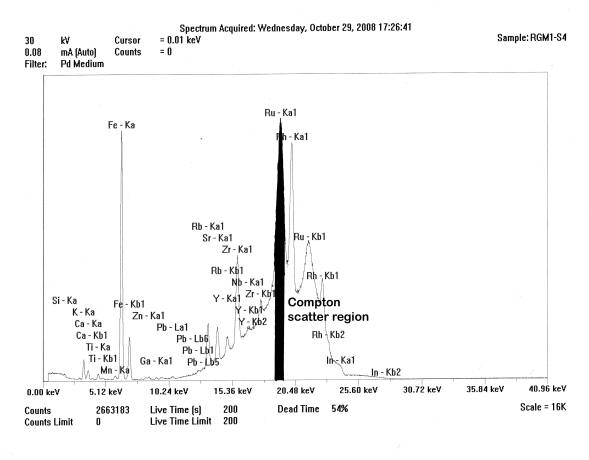
Spectrum of the ThermoScientific Quant’X mid-Zb analysis of USGS RGM-1, showing the Compton scattered “hump” and that portion of the region under the Ru peak (blackened) used for peak ratioing. Notice peak overlaps.
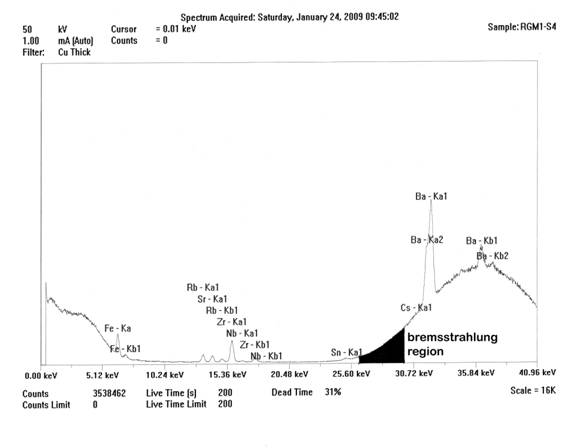
Spectrum of the ThermoScientific Quant’X high-Za analysis of USGS RGM-1, showing the bremsstrahlung region and that portion of the region (blackened) used for peak ratioing. Decreased deadtime is the result of analysis at the outer edge of keV capability of the instrument.
WAVELENGTH AND ENERGY-DISPERSIVE XRF
X-ray fluorescence can be measured and quantified in two ways. Wavelength dispersive XRF uses a crystal to separate the various wavelengths: for every angle of incident radiation, the only wavelength reflected to the detector is the one that conforms to Bragg’s formula:
nl = 2d sin q
where n is a whole number 1-n, l is the wavelength of the x-ray radiation used; d is a constant characteristic of every crystalline substance (i.e. the x-ray crystal); and q is the angle on incidence of the x-radiation on the sample.
So, by changing the angle of the crystal, you can select for specific elements of interest. In the Philips PW 2400 at Berkeley, this is all done automatically and any combination of elements can be analyzed. The system changes crystals for the various elements, calculates the overlap of elements within the spectrum and yields results in any form desired: qualitative, ratio, quantitative, graphic.
The Philips PW 2400 WXRF originally used at Berkeley is capable of measuring all elements from beryllium (atomic number 4) to uranium (atomic number 92) and beyond (at trace levels, often below one part per million, and up to 100%). As with EDXRF, WXRF can analyze obsidian samples non-destructively by ratioing the data to the Compton or Bremsstrahlung regions, artifacts of x-radiation that are of constant intensity relative to the mass of the sample and therefore useful in generating quantitative data regardless of surface configuration or mass (see Davis et al. 2011).
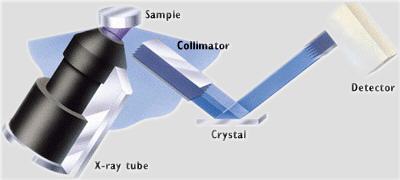
Schematic of analysis of a sample in the Philips 2400 WXRF
ENERGY-DISPERSIVE XRF (EDXRF)
The second and more common method in North America for analyzing obsidian is EDXRF
EDXRF systems detect elements on the periodic table between atomic numbers 11 (Na) and 92 (U). Samples can be analyzed non-destructively with little or no sample preparation in minutes and in some cases seconds. Elements in concentrations from as low as a few parts per million to 100% may be analyzed in the same sample simultaneously. Accuracy of less than one percent relative error are attainable with comparable reproducibility
Analysis by EDXRF, like WXRF involves use of ionizing radiation to excite the sample, followed by detection and measurement of X-rays leaving the sample that are characteristic of the elements in the sample.
However, unlike the crystal (wavelength) XRF, EDXRF spectrometer electronics digitize the signal produced by X-rays entering the lithium drifted detector, and send this information to the PC for display and analysis. The Na to U spectral data are in the 1-37 KeV range.
In the Quant'X systems, which are the primary laboratory or desktop instruments in most of the North American labs analyzing obsidian, the high resolution lithium drifted silicon X-ray detectors provide low detection limits, few spectral interferences, and accuracy over a wide range of concentrations. These detectors are able to separate the electron energy coming from the sample into elemental components, which in turn are translated into ratio, qualitative, or quantitative elemental data in spreadsheet or word processor formats. Additionally, the tube voltages on EDXRF are quite low and the entire instrument is plugged into a standard wall socket. WXRF requires filtered voltage at 220 V.
The appeal of x-ray analysis of archeological specimens lies in its remarkable combination of practical and economic advantages:
NON-DESTRUCTIVE
In the vast majority of cases, analyzed samples are not destroyed or changed by exposure to x-rays. They can thus be saved for future reference or used for other types of testing that may be destructive.MINIMAL PREPARATION
Many samples can be examined with little or no pre-treatment, including almost all obsidian artifacts. Many of the alternative techniques require dissolution procedures that are both time-consuming and costly in terms of the acids or other reagents required.FAST
X-ray spectrometry enables chemical compositions to be determined in seconds. For an analysis of the elements Ti-Nb on the Berkeley Spectrace instrument, it takes approximately 250 live seconds per sample (about 6 to 8 min. per sample depending on mass).EASY TO USE
Modern instruments run under computer control, with effective software to handle measurement set-up and results calculation. Tasks that once required the constant attention of a trained analyst can now be handled by skilled operators — or even carried out by fully automated systems.
This page maintained by Steve Shackley (shackley@berkeley.edu).
Revised: Monday, 15 December 2025 03:09:39 PM -0700
![]() Back to SW Obsidian Sources page
Back to SW Obsidian Sources page
![]()