TOPAZ BASIN
Transition Zone, Central Arizona
REGIONAL GEOLOGICAL CONTEXT
Lying between the Colorado Plateau and Basin and Range Provinces, the Transition Zone is characterized by rugged relief, dissected drainage basins, and large early bedrock basins and plateau remnants (Menges and Pearthtree 1989). In Arizona the concept of “Transition Zone” moves slightly beyond the more traditional definition as a physiographic/geologic region. Since the Colorado Plateau is a result of largely continental tectonic movement and a true basin and range province to the south, it becomes a true structural transition between very large events, the Basin and Range mainly in the Tertiary, and the uplifted Colorado Plateau afterwards into the Quaternary, and is characterized as a a region of “complex crustal geochemistry and structure” (Moyer and Esperanca, 1989:7841; see also Bennett and DePaolo, 1987). Volcanism in the Transition Zone tends to be dominated by basalt and a lesser extent andesite. Rhyolite, particularly eruptive events that quenched to produce glass is very rare, unlike in volcanic regions of the Basin and Range and Colorado Plateau provinces. The only artifact quality obsidian located in the Transition Zone occurs at Burro Creek and Bull Creek in the Kaiser Spring Volcanic Field in western Arizona west of Prescott, Arizona (Figure 1) and the Topaz Basin domes discussed here (see Moyer, 1982, 1986; Moyer and Esperanca, 1989; Shackley, 2005a). Parenthetically, these three sources are all “minor” in that they rarely occur in the regional archaeological record, although do occur in minor proportions in assemblages within radii of perhaps 30-50 km around the sources. Additionally, while all of these sources have been redistributed through erosion into secondary deposits, none were transported great distances like Mule Creek, Cow Canyon in eastern Arizona and western New Mexico (>100 km from the primary deposits), or the northern New Mexico sources such as Mount Taylor and Cerro Toledo Rhyolite that were transported hundreds of kilometers south at least to Chihuahua (Church, 2000; Shackley, 1992, 1998a, 1998b, 2005a). This is potentially one of the reasons that these Transition Zone sources are not as common in the archaeological record as sources from other geological regions. While it could be argued that the nodule sizes are small, these sources exhibit marekanites equally as large as Mule Creek, a source that is distributed widely across the Southwestern archaeological landscape.
Specific Geological Setting
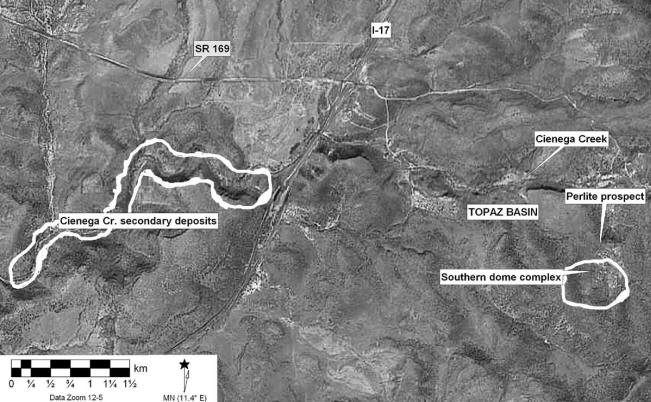
Location of Topaz Basin primary and secondary contexts (From Shackley 2009).
No intensive geological investigations have occurred in the specific area near Topaz Basin (see Arizona Bureau of Mines, 1958; Menges and Pearthtree 1989; Nealy and Sheridan 1989). There have been tectonic and geophysical studies to the east at Hackberry Mountain, and northwest in the Black Hills, but not along Cienega Creek or the Bald Hill area (Lewis 1983; Wittke 1984). The Topaz Basin appears to be on a plateau remnant composed of basalt flows and rhyolite domes in the Central Basin Section of the Transition Zone. The basin proper, while noted on the USGS Arnold Mesa 7.5’ topographic map, is not delimited in any way. In fact, the “basin” around the notation on the map is mainly rhyolite domes pertinent here. There are no radiometric dates for the basalt or rhyolite, but could be similar to the bimodal basalt to high silica rhyolite Transition Zone fields to the west. (Moyer, 1982, 1986; Moyer and Esperanca 1989; Neeley and Sheridan, 1989). In the Kaiser Spring Volcanic Field in the western portion of the Transition Zone, early tholeiitic basalt (ca. 12-15 ma) is followed by high silica rhyolites (ca. 11-12 ma) and final sporadic alkalic basalt. Without radiometric dating at Topaz Basin, it is impossible to know what the eruptive trajectory was, although my in-field assessment suggests that the rhyolite dome events are earlier and have been partly subsumed and underlie subsequent basalt flows.
The basin is tilted to the west and so all material is eroding into Cienega Creek (Figure 2), a tributary of Ash Creek which flows into the Agua Fria River and ultimately into the Gila River, rather than the Verde River to the east. The most recent geological investigations in the basin are by Ed Dewitt of the U.S. Geological Survey who has been working on a generalized map of the region. His mapping based on GIS satellite technology did not detect the rhyolite domes in the area, precisely because they are limited in distribution, and were only indicated by “ashy areas” thought to be “siliceous volcanic rocks”, which is indeed the case. The rhyolite dome complex that produced the obsidian is relatively small compared with the large expanse of basalt cinder cones and flows in the area, and this level of investigation can easily miss small dome structures – a common structural context for quenched rhyolite (see Fink and Anderson, 2000; Fink and Manley, 1987; Hughes and Smith, 1993; Shackley, 2005a.
The primary source appears to be a southeast-northwest trending highly eroded dome complex that apparently extends discontinuously from the eastern end of Topaz Basin to nearly Interstate 17 on the west (Figure 2). Artifact quality marekanites are eroding out of the margins of remnant domes particularly around the “basin” proper. The upper reaches of Cienega Creek appear to have eroded between what apparently are dome remnants north and south of the Cienega Creek wash. These were conveniently called “north” or “south” domes, but could have been one large continuous dome complex in the Tertiary. Perlite with embedded remnant marekanites is visible on the domes when exposed. One probable historic perlite prospect in the “northern domes” exhibits marekanite remnants within perlite in relative high densities (> 100/m2), and on the surface just north of the prospect the surface density is ≥ 400 marekanites/m2 (Figure 3). Remnant marekanites in a devitrified glass (perlite) lava is typical in Tertiary sources worldwide, and particularly in the North American Southwest (Shackley 2005a).
The nodule sizes vary from pea gravel to over 57 mm in largest dimension. The domes to the south of the perlite prospect appear to exhibit somewhat larger mean sizes (over 30 mm), but this could be that most modern collections could have occurred nearer the perlite prospect. The cortex on the marekanites varies from perlite coverings for those recently eroded, to the “velvet like” chemically weathered cortex common on marekanites in arid climates (Shackley, 2005)
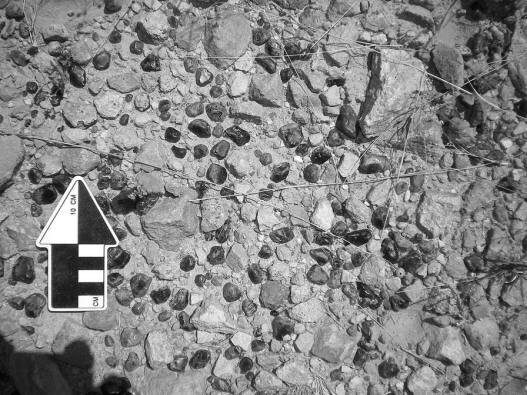
In-situ marekanites near perlite prospect.
What is most interesting about these obsidian marekanites is how nearly transparent they are. Similar to the Superior (Picketpost Mountain) source east of Phoenix, thin flakes of this obsidian appear transparent and slightly smoky with rare banding or clouding (Shackley, 1988, 2005a). Most of the recently eroded marekanites such as those excavated from the perlite, are nearly transparent in transmitted light. Holding small nodules up to the sun they could easily be mistaken for topaz nodules. Topaz an orthorhombic aluminum-silicate mineral is precipitated from siliceous igneous rocks such as rhyolite, so the environmental context is approximate (see Burt et al., 1981). They can occur as prismatic crystals or rounded waterworn pebbles, and look very much like transparent obsidian nodules. No topaz proper was located during the survey. It’s perfectly possible that these transparent nodules were mistaken for topaz in the late 19th or early 20th century, and might have led to the prospecting evident today. Topaz Basin then becomes an appropriate name for this obsidian source.
Secondary Depositional Context
The secondary distribution of a stone source is just as important to understand as the primary source, since aboriginal knappers care little about where they get quality toolstone (Church, 2000; Shackley, 1992, 1998b, 2005a). As mentioned above, the Topaz Basin is tilted slightly to the west. The Tertiary Topaz Basin marekanites have probably been eroding west through the upper Cienega Creek and southwest potentially into the Agua Fria River for millions of years, although I have never detected obsidian in the Agua Fria River alluvium, nor has it appeared in archaeological context in the Phoenix Basin (see Shackley, 1990). Given the shallow hillslope gradient, at least in the Holocene, and probable bedrock weathering mechanics, it was not surprising that Topaz Basin marekanites were rare downstream. Two nodules, the largest only about 20 mm in diameter were located in the Cienega Creek alluvium approximately six stream kilometers west (see Figure 2). The analysis of these two specimens was well within the elemental concentrations from the primary source (Table 1). Given that marekanites are up to 50 mm in diameter at the primary domes, stream competence of first order drainages within the basin,at least in the Holocene, has been generally low, and/or the primary material has not been released in any quantity into the Cienega Creek system. As noted above, this is probably one reason that this source has not appeared commonly in archaeological context – it is a true point source with little secondary distribution.
GEOCHEMISTRY AND ARCHAEOLOGY
Approximately 500 samples were collected at the source from pea size to over 50 mm in diameter. A judgmental sample of 45 (» 9 %) was selected from the northern and southern domes from pea size to that largest nodule from the southern domes for EDXRF analysis.
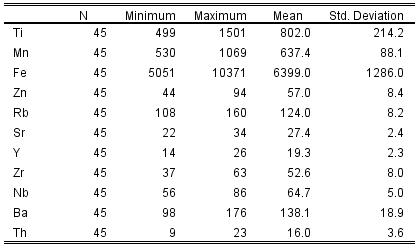
Eleven elements of the 16 acquired by EDXRF are reported here. As noted above, and discovered by Phil Geib during the project, the elemental composition of the Topaz Basin sources does not match any known from the North American Southwest; it is compositionally unique (Table 1; see Shackley 1995, 2005a). Most of the transition metals exhibit a relatively tight distribution except for Rb and to a certain extent Ba. Iron that does not always operate as an incompatible in silicic volcanics is more variable (Table 1).
Table 1. Elemental concentrations for the Topaz Basin obsidian source standards, Yavapai County, Arizona. All measurements in parts per million (ppm). Measured on the Quant’X EDXRF spectrometer at Berkeley (see Shackley 2005a or http://www.swxrflab.net/anlysis.htm for instrument settings and protocols).
| Sample | Ti | Mn | Fe | Zn | Rb | Sr | Y | Zr | Nb | Ba | Th |
| BH-1 | 499 | 658 | 5207 | 45 | 116 | 26 | 24 | 37 | 60 | 106 | 20 |
| BH-2 | 614 | 752 | 5760 | 44 | 122 | 28 | 19 | 41 | 60 | 106 | 16 |
| BH-3 | 572 | 709 | 5623 | 47 | 126 | 30 | 21 | 43 | 65 | 120 | 15 |
| BH-4 | 632 | 626 | 5434 | 50 | 111 | 25 | 22 | 39 | 60 | 111 | 10 |
| BH-5 | 510 | 754 | 5784 | 54 | 134 | 26 | 21 | 47 | 70 | 136 | 23 |
| BH-6 | 792 | 688 | 6548 | 55 | 117 | 29 | 18 | 41 | 57 | 121 | 15 |
| BH-7 | 748 | 682 | 6562 | 52 | 118 | 26 | 17 | 37 | 56 | 98 | 14 |
| BH-8 | 531 | 731 | 5535 | 79 | 122 | 23 | 20 | 38 | 64 | 121 | 17 |
| BH-9 | 1100 | 742 | 8734 | 53 | 121 | 31 | 18 | 44 | 59 | 100 | 15 |
| BH-10 | 527 | 701 | 5566 | 59 | 116 | 26 | 21 | 41 | 61 | 128 | 13 |
| BH-11 | 669 | 622 | 6175 | 57 | 118 | 25 | 14 | 40 | 60 | 130 | 18 |
| BH-12 | 616 | 578 | 5551 | 50 | 118 | 27 | 21 | 41 | 62 | 120 | 20 |
| BH-13 | 622 | 727 | 6084 | 59 | 160 | 31 | 26 | 63 | 86 | 134 | 15 |
| BH-14 | 949 | 602 | 8477 | 44 | 121 | 34 | 21 | 46 | 69 | 133 | 23 |
| BH-15 | 1231 | 1069 | 10371 | 66 | 137 | 32 | 19 | 47 | 69 | 124 | 23 |
| 060708-1-1 | 727 | 635 | 5679 | 57 | 132 | 29 | 22 | 56 | 66 | 133 | 14 |
| -2 | 722 | 586 | 5317 | 53 | 126 | 27 | 22 | 53 | 65 | 145 | 13 |
| -3 | 716 | 613 | 5614 | 59 | 125 | 27 | 17 | 59 | 66 | 160 | 17 |
| -4 | 691 | 616 | 5566 | 60 | 128 | 27 | 19 | 60 | 68 | 157 | 16 |
| -5 | 688 | 555 | 5259 | 51 | 123 | 27 | 18 | 57 | 64 | 160 | 11 |
| -6 | 683 | 569 | 5351 | 61 | 123 | 27 | 23 | 53 | 63 | 158 | 19 |
| -7 | 718 | 606 | 5513 | 55 | 122 | 28 | 18 | 56 | 64 | 140 | 23 |
| -8 | 710 | 568 | 5433 | 60 | 125 | 28 | 18 | 55 | 62 | 133 | 16 |
| -9 | 739 | 530 | 5051 | 94 | 108 | 22 | 17 | 51 | 57 | 148 | 9 |
| -10 | 873 | 672 | 6898 | 56 | 135 | 28 | 16 | 60 | 70 | 136 | 13 |
| -11 | 677 | 530 | 5338 | 55 | 118 | 26 | 18 | 59 | 62 | 143 | 14 |
| -12 | 747 | 642 | 5983 | 57 | 130 | 28 | 18 | 58 | 69 | 147 | 16 |
| -13 | 720 | 577 | 5713 | 56 | 123 | 27 | 18 | 57 | 63 | 160 | 12 |
| -14 | 741 | 559 | 5623 | 62 | 118 | 25 | 18 | 56 | 63 | 140 | 19 |
| -15 | 762 | 636 | 5833 | 57 | 126 | 28 | 20 | 58 | 64 | 144 | 13 |
| -16 | 1101 | 572 | 7782 | 70 | 111 | 27 | 21 | 57 | 62 | 145 | 15 |
| -17 | 1007 | 643 | 7557 | 55 | 128 | 32 | 22 | 59 | 72 | 167 | 16 |
| -18 | 1501 | 678 | 10214 | 61 | 130 | 30 | 19 | 63 | 70 | 159 | 20 |
| -19 | 725 | 628 | 5619 | 54 | 125 | 28 | 18 | 58 | 70 | 176 | 16 |
| 060708-1-20 | 1194 | 632 | 8200 | 59 | 121 | 29 | 22 | 61 | 63 | 132 | 16 |
| -21 | 992 | 621 | 7219 | 57 | 121 | 29 | 21 | 57 | 66 | 137 | 21 |
| -22 | 1097 | 656 | 7656 | 59 | 129 | 28 | 19 | 59 | 64 | 119 | 19 |
| -23 | 828 | 568 | 5899 | 52 | 123 | 26 | 18 | 59 | 68 | 156 | 21 |
| -24 | 729 | 574 | 5802 | 54 | 122 | 24 | 15 | 56 | 65 | 159 | 13 |
| -25 | 836 | 604 | 6196 | 54 | 126 | 26 | 16 | 57 | 69 | 140 | 15 |
| -26 | 928 | 612 | 7138 | 59 | 124 | 30 | 20 | 59 | 66 | 143 | 14 |
| -27 | 724 | 593 | 5639 | 55 | 120 | 26 | 17 | 58 | 64 | 133 | 17 |
| -28 | 837 | 589 | 6296 | 60 | 123 | 24 | 18 | 60 | 61 | 153 | 14 |
| -29 | 891 | 573 | 6954 | 57 | 127 | 25 | 18 | 57 | 65 | 174 | 11 |
| -30 | 1172 | 606 | 8201 | 57 | 128 | 29 | 21 | 54 | 63 | 132 | 16 |
Mean and central tendency for the data in table above
![]()
This page maintained by Steve Shackley (shackley@berkeley.edu).
Copyright © 2018 M. Steven Shackley. All rights reserved.
Revised: 03 November 2018