Sierra Fresnal
This is one of the few "sources" in northwest Mexico where marekanites are associated with coalesced rhyolite domes. All the dome structures are highly eroded and none exhibited in-situ obsidian zones with marekanites. Indeed, it appears that much of the Sierra Fresnal is composed of rhyolite in a series of northwest-southeast trending coalesced domes. The domes are highly eroded and have produced a regolith of silicic ash, rhyolite lava and obsidian that is eroding east toward Lago Fresnal and Lago Guzman (see map below). Indeed, samples collected from the Arroyo Casas Grandes alluvium 70 km north of Sierra Fresnal exhibit the same elemental concentrations (see Appendix). The Sierra Fresnal collection area is between UTMs 13R 0254349/3446168 and 0249566/3446086 on the INEGI Guzman 1:50,000 H13A42 sheet. The density of nodules near the domes on the east side of the Sierra is up to 50 per 100m2 and down to 1 per 50m2 one km east toward Lago Fresnal. Bipolar cores and flakes occur very rarely.
Sierra Fresnal nodules have been located in alluvium west of the Sierra Fresnal as well at Arroyo Seco south of Nuevo Casas Grandes and at Lago Fredrico (see Chihuahua map below). At Lago Fredrico nodules collected by Alan Phelps just west of Sierra Fresnal exhibit different elemental concentrations, probably derived from a different magma source. This source, while not common, shows up in sites in southern New Mexico with some regularity. It is impossible at this point, however, to determine exactly where the raw material was procured prehistorically, either at the primary source or in secondary deposits in the Rio Casas Grandes alluvium nearer the border.
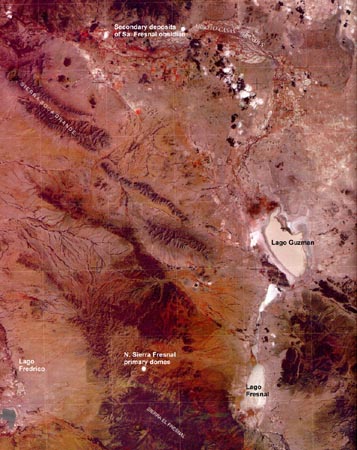
Satellite shaded relief map of a portion of the basin and range region of northeastern Chihuahua showing the location and relationship between the Sierra Fresnal and Lago Fredrico secondary deposits of obsidian (from the INEGI Ciudad Juarez 1:250,000 H 13-1 sheet. Width of grids 1000 meters, sheet oriented north-south.
Table 1. Raw data for Sierra Fresnal, west side of domes, and east side of domes. All measurements in parts per million (ppm). Blank cells = elements not acquired.
Sample Ti Mn Fe Zn Rb Sr Y Zr Nb Ba Pb Th West Side 092098-1-1 1092 334 9946 52 307 42 63 169 38 237 30 39 092098-1-2 1140 318 10540 43 301 43 64 168 37 208 24 45 092098-1-3 1115 293 10064 44 287 39 65 160 35 238 23 39 092098-1-4 1199 335 10743 47 311 43 65 164 41 242 24 40 092098-1-5 1174 295 10601 44 298 43 70 159 36 200 24 38 092098-1-6 1158 317 10582 46 304 42 63 160 36 249 26 46 East Side 092098-2-1 1213 395 10434 43 264 39 63 167 37 283 26 38 092098-2-2 1162 356 10444 54 315 44 73 174 36 249 28 33 092098-2-3 1429 401 12099 53 304 43 65 173 36 234 28 36 092098-2-4 987 289 8525 48 269 38 58 158 31 291 26 39 092098-2-5 1361 409 13056 59 300 41 62 169 40 185 29 38 092098-2-6 996 322 9191 47 291 41 60 169 34 232 27 33 092098-2-7 984 318 8962 46 288 40 66 167 33 265 28 37 092098-2-8 1008 311 9230 47 299 40 64 169 39 282 26 39 092098-2-9 1068 338 9565 47 297 38 62 168 36 218 27 48 092098-2-10 1202 309 11423 324 40 67 172 38 46 092098-2-11 1220 276 10769 297 37 62 164 33 40 092098-2-12 1168 314 11181 322 35 67 175 33 47 092098-2-13 1138 305 11305 320 39 63 171 34 61 092098-2-14 1192 313 10804 45 308 44 64 164 37 270 26 47 092098-2-15 1220 352 11022 47 311 47 64 168 38 245 29 37 092098-2-16 1181 317 10366 50 298 41 65 164 39 247 23 43 092098-2-17 1224 320 10970 53 308 40 65 163 35 217 25 37 092098-2-18 1096 292 10207 47 295 42 66 157 34 232 22 49 092098-2-19 1181 295 10540 45 293 44 66 163 40 252 23 37 092098-2-20 1279 357 11255 48 319 45 65 168 37 254 28 41 RGM1-S4 1634 279 13155 38 149 107 24 217 9 879 21 18
Table 2. Mean and central tendency for the data in Table 1.
N
Minimum
Maximum
Mean
Std. Deviation
Ti
26
984
1429
1161
105.4
Mn
26
276
409
326
34.5
Fe
26
8525
13056
10532
967.7
Zn
22
43
59
48
3.9
Rb
26
264
324
301
14.5
Sr
26
35
47
41
2.8
Y
26
58
73
65
2.9
Zr
26
157
175
166
4.9
Nb
26
31
41
36
2.5
Ba
22
185
291
242
26.8
Pb
22
22
30
26
15.4
Th
26
33
61
41
34.5
Table 3. Major oxide values for two samples of Sierra Fresnal source standards, plus the analysis of an RGM-1 pressed powder standard. All measurements in percent by weight (wt.%).
Sample
SiO2
Al2O3
CaO
Fe2O3
K2O
MgO
MnO
Na2O
TiO2
Sierra Fresnal
092098-2-3 (east side)
76.914
11.398
0.715
1.297
5.875
<.001
0.053
3.386
0.159
092098-1-2 (west side) 76.97 11.384 0.7178 1.271 5.844 <.001 0.040 3.44 0.119 RGM1-S4
75.680
12.477
1.3024
1.806
4.550
<.001
0.0379
3.77
0.196
Oxides for a single Sierra Fresnal sample, plus the analysis of RGM-1.
![]() Back to SW Obsidian Sources page
Back to SW Obsidian Sources page
Revised: 21 March 2015