DEVIL PEAK
CLARK COUNTY, NEVADA
![]()
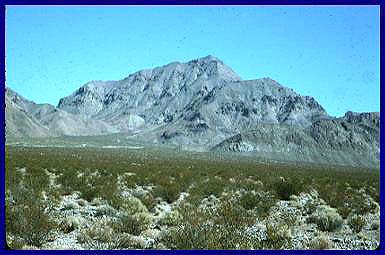
Tertiary Devil Peak (center) within the Precambrian limestones of the Spring Mountains, Nevada
This source in extreme southern Nevada was discovered independently by Shackley (1988b) and Philip Wilke. Devil Peak is a series of coalesced rhyolite domes of Tertiary age that have extruded through the Paleozoic Monte Cristo Limestones of the Spring Mountains (Longwell et al. 1965). Devil Peak is located on Stateline Pass 7.5' Provisional Quad 1985 near the center of the sheet. Here nodules are found in situ in a perlite matrix on both the east and west sides of the peak eroding into either the interior drainage basins of Mesquite Lake on the west or Roach Lake on the east. Historic perlite mining on both sides of the peak has essentially destroyed any evidence of prehistoric production. Some tool manufacturing debris was noted in the alluvium east of the peak toward Roach Lake (Shackley 1988b; Wilke: personal communication 1993). The archaeological context of the eastern locus is now designated site 26-CK-3865 (Shackley 1988b).
Perlite matrix with in situ marekenites is located on the west near the Umpire Perlite Mines between UTM 3952000 and 3951000/637000 and 639000 (no sections on map). Perlite matrix with in situ marekenites is located on a series of very small rhyolite domes on the east flank of the Spring Mountains between UTM 3953000 and 3951000/642000 and 644000 all on the Stateline Pass 7.5' Provisional Quad 1985. The density of nodules in both areas in the perlite is up to 100 per m2, although most of the marekenites are less than 30 mm in diameter. Nodules up to 100 mm in diameter have been recovered, but most are less than 40 mm. The density of nodules on the east shoreline of Mesquite Lake is about 1 per 20 m2, and about 1 per 100 m2 on the shoreline of Roach Lake to the east. Significant chemical differences in some trace elements exist between obsidian from the east and west sides of Devil Peak. The nodules on the west side are generally superior media for tool production than those on the east. The "western" marekenites are generally more translucent and brittle, while the "eastern" nodules tend to be less vitreous, opaque and contain some plagioclase or sanidine phenocrysts. This may be due to wall rock reactions with the limestone during eruptive events on the east with the small dome structures. Bipolar cores and flakes occurred rarely, in part no doubt due to the perlite mining in the area. The only published references known are Longwell et al. (1965), and Shackley (1988b). This source was reported in the Journal of California and Great Basin Anthropology (Shackley 1994). The elemental composition of the two sources are quite different as can be seen in the mean and central tendency tables below.
Raw elemental concentrations for Devil Peak East (E) and West (W) source standards. All measurements in parts per million (ppm).
| SAMPLE | Ti | Mn | Fe | Pb | Rb | Sr | Y | Zr | Nb | Ba | La | Ce |
| E | 572 | 590 | 8780 | 44 | 210 | 109 | 30 | 105 | 23 | 315 | 55 | 101 |
| E | 557 | 535 | 8271 | 37 | 194 | 105 | 30 | 102 | 27 | 330 | 55 | 107 |
| E | 595 | 584 | 8559 | 43 | 206 | 106 | 27 | 106 | 21 | 354 | 65 | 116 |
| E | 753 | 784 | 10410 | 52 | 233 | 125 | 34 | 116 | 27 | 323 | 59 | 107 |
| E | 616 | 566 | 8554 | 39 | 200 | 109 | 33 | 110 | 23 | 348 | 61 | 108 |
| E | 565 | 586 | 8323 | 35 | 197 | 106 | 25 | 106 | 24 | 303 | 54 | 108 |
| E | 642 | 597 | 8800 | 44 | 194 | 103 | 25 | 108 | 26 | 415 | 73 | 142 |
| E | 583 | 599 | 8532 | 39 | 203 | 105 | 29 | 105 | 26 | 406 | 71 | 133 |
| E | 626 | 608 | 8895 | 47 | 210 | 113 | 26 | 111 | 31 | 301 | 52 | 103 |
| E | 502 | 550 | 8221 | 44 | 195 | 101 | 28 | 106 | 25 | 331 | 50 | 107 |
| E | 571 | 556 | 8033 | 39 | 194 | 103 | 27 | 109 | 24 | |||
| E | 570 | 547 | 8092 | 40 | 197 | 106 | 28 | 109 | 26 | |||
| E | 722 | 586 | 8372 | 44 | 204 | 107 | 28 | 108 | 25 | |||
| E | 628 | 585 | 8379 | 41 | 195 | 108 | 30 | 105 | 23 | |||
| E | 666 | 627 | 8739 | 45 | 212 | 114 | 35 | 110 | 29 | |||
| E | 577 | 574 | 8146 | 38 | 197 | 104 | 27 | 103 | 26 | |||
| E | 689 | 651 | 8933 | 40 | 204 | 111 | 31 | 108 | 25 | |||
| E | 583 | 577 | 8022 | 38 | 193 | 105 | 31 | 105 | 26 | |||
| E | 564 | 542 | 8031 | 39 | 189 | 106 | 31 | 102 | 26 | |||
| E | 617 | 542 | 8051 | 40 | 194 | 108 | 32 | 106 | 23 | |||
| E | 671 | 585 | 8294 | 39 | 199 | 108 | 32 | 107 | 25 | |||
| E | 624 | 558 | 8117 | 40 | 191 | 103 | 28 | 103 | 27 | |||
| E | 642 | 552 | 8068 | 37 | 193 | 103 | 31 | 104 | 22 | |||
| E | 612 | 645 | 8912 | 43 | 211 | 113 | 31 | 111 | 27 | |||
| E | 654 | 553 | 8256 | 42 | 200 | 109 | 31 | 108 | 25 | |||
| E | 542 | 546 | 7798 | 36 | 183 | 103 | 29 | 104 | 26 | |||
| E | 782 | 701 | 9662 | 43 | 210 | 115 | 34 | 110 | 27 | |||
| E | 696 | 580 | 8606 | 47 | 210 | 117 | 32 | 109 | 33 | |||
| E | 738 | 602 | 8553 | 43 | 206 | 112 | 28 | 109 | 25 | |||
| E | 616 | 621 | 8585 | 30 | 205 | 113 | 29 | 109 | 28 | |||
| E | 693 | 553 | 7820 | 29 | 194 | 105 | 29 | 106 | 20 | |||
| E | 628 | 567 | 8290 | 30 | 200 | 108 | 32 | 108 | 25 | |||
| E | 516 | 533 | 7883 | 194 | 111 | 26 | 107 | 29 | 346 | |||
| E | 653 | 596 | 9423 | 195 | 163 | 26 | 133 | 26 | 505 | |||
| E | 693 | 633 | 8630 | 211 | 111 | 27 | 107 | 27 | 344 | |||
| E | 675 | 548 | 7997 | 195 | 106 | 28 | 108 | 23 | 331 | |||
| E | 624 | 584 | 8588 | 214 | 113 | 32 | 111 | 27 | 352 | |||
| E | 636 | 612 | 8227 | 198 | 107 | 29 | 106 | 22 | 336 | |||
| E | 799 | 582 | 9238 | 204 | 146 | 23 | 126 | 24 | 439 | |||
| E | 669 | 624 | 8394 | 197 | 110 | 27 | 107 | 26 | 334 | |||
| E | 614 | 564 | 8273 | 199 | 111 | 29 | 110 | 26 | 343 | |||
| E | 640 | 574 | 8134 | 196 | 110 | 28 | 112 | 28 | 353 | |||
| E | 743 | 809 | 9597 | 241 | 101 | 35 | 107 | 31 | 234 | |||
| E | 509 | 533 | 7623 | 184 | 100 | 28 | 104 | 25 | 334 | |||
| E | 503 | 600 | 8113 | 201 | 107 | 30 | 111 | 26 | 343 | |||
| E | 610 | 591 | 8176 | 197 | 107 | 28 | 109 | 27 | 317 | |||
| W | 806 | 469 | 9133 | 37 | 160 | 236 | 23 | 146 | 20 | 975 | 104 | 178 |
| W | 835 | 577 | 10499 | 44 | 188 | 260 | 26 | 163 | 20 | 1073 | 106 | 204 |
| W | 990 | 590 | 10853 | 43 | 194 | 266 | 27 | 161 | 22 | 884 | 94 | 163 |
| W | 605 | 413 | 8661 | 35 | 158 | 230 | 25 | 145 | 23 | 924 | 91 | 173 |
| W | 806 | 548 | 9941 | 43 | 180 | 253 | 25 | 160 | 22 | 777 | 80 | 146 |
| W | 824 | 530 | 10278 | 45 | 181 | 261 | 29 | 167 | 24 | 745 | 73 | 144 |
| W | 941 | 568 | 10702 | 45 | 188 | 261 | 27 | 159 | 25 | 821 | 83 | 154 |
| W | 768 | 516 | 9521 | 37 | 174 | 245 | 27 | 152 | 25 | 862 | 84 | 165 |
| W | 758 | 550 | 9923 | 42 | 179 | 253 | 23 | 155 | 24 | 807 | 74 | 148 |
| W | 710 | 516 | 9339 | 36 | 172 | 247 | 26 | 153 | 20 | 830 | 77 | 159 |
| W | 828 | 565 | 10287 | 183 | 259 | 26 | 157 | 26 | 762 | |||
| W | 893 | 524 | 10162 | 182 | 250 | 25 | 153 | 24 | 1193 | |||
| W | 737 | 516 | 9628 | 173 | 244 | 26 | 152 | 23 | 898 | |||
| W | 958 | 612 | 10552 | 183 | 252 | 28 | 156 | 23 | 812 | |||
| W | 771 | 577 | 10158 | 184 | 253 | 25 | 153 | 25 | 777 |
Mean and central tendency for Devil Peak East source standard elemental concentrations
|
|
N |
Minimum |
Maximum |
Mean |
Std. Deviation |
|
Ti |
46 |
502 |
799 |
630.0 |
70.8 |
|
Mn |
46 |
533 |
809 |
592.0 |
56.1 |
|
Fe |
46 |
7623 |
10410 |
8465.2 |
538.5 |
|
Rb |
46 |
183 |
241 |
201.1 |
10.6 |
|
Sr |
46 |
100 |
163 |
110.1 |
10.8 |
|
Y |
46 |
23 |
35 |
29.3 |
2.7 |
|
Zr |
46 |
102 |
133 |
108.4 |
5.4 |
|
Nb |
46 |
20 |
33 |
25.7 |
2.5 |
|
Ba |
24 |
234 |
505 |
347.4 |
52.0 |
|
La |
10 |
50 |
73 |
59.5 |
7.9 |
|
Ce |
10 |
101 |
142 |
113.2 |
13.5 |
|
Pb |
32 |
29 |
52 |
40.2 |
5.0 |
Mean and central tendency for Devil Peak West source standard elemental concentrations
|
|
N |
Minimum |
Maximum |
Mean |
Std. Deviation |
|
Ti |
15 |
605 |
990 |
815.3 |
100.9 |
|
Mn |
15 |
413 |
612 |
538.1 |
50.1 |
|
Fe |
15 |
8661 |
10853 |
9975.8 |
617.3 |
|
Rb |
15 |
158 |
194 |
178.6 |
9.9 |
|
Sr |
15 |
230 |
266 |
251.3 |
9.8 |
|
Y |
15 |
23 |
29 |
25.9 |
1.6 |
|
Zr |
15 |
145 |
167 |
155.5 |
6.0 |
|
Nb |
15 |
20 |
26 |
23.1 |
1.9 |
|
Ba |
15 |
745 |
1193 |
876.0 |
124.2 |
|
La |
10 |
73 |
106 |
86.6 |
11.8 |
|
Ce |
10 |
144 |
204 |
163.4 |
18.2 |
|
Pb |
10 |
35 |
45 |
40.7 |
4.0 |
![]()
This page maintained by Steve Shackley (shackley@berkeley.edu).
Copyright © 2002 M. Steven Shackley. All rights reserved.
Revised: 23 November 2023
![]() Back to
the SW obsidian source page
Back to
the SW obsidian source page
![]()