THERMOFISHER SCIENTIFIC QUANT'X ANALYSIS AND INSTRUMENTATION
The following is the analytical trajectory used in the EDXRF analysis of archaeological, source standard obsidian and metal samples in the EDXRF lab at Albuquerque.
The ThermoFisher Scientific Quant'X EDXRF spectrometer methods:
All archaeological samples are analyzed whole completely non-destructively. The results presented here are quantitative in that they are derived from "filtered" intensity values ratioed to the appropriate x-ray continuum regions through a least squares fitting formula rather than plotting the proportions of the net intensities in a ternary system (McCarthy and Schamber 1981; Schamber 1977). Or more essentially, these data through the analysis of international rock standards, allow for inter-instrument comparison with a predictable degree of certainty (Hampel 1984).
All analyses for this study were conducted on a ThermoScientific Quant�X EDXRF spectrometer, located at the Geoarchaeological XRF Laboratory, Albuquerque, New Mexico. It is equipped with a thermoelectrically Peltier cooled solid-state Si(Li) X-ray detector, 155eV FWHM resolution. with a 50 kV, 50 W, ultra-high-flux end window bremsstrahlung Rh target X-ray tube and a 76 �m (0.3 mil) beryllium (Be) window (air cooled), that runs on a power supply operating from 4-50 kV/0.02-1.0 mA at 0.02 increments. Distance from sample to detector = 28.5 mm, to x-ray target = 54.1 mm. The spectrometer is equipped with a 200 l min−1 Edwards vacuum pump, allowing for the analysis of lower-atomic-weight elements between sodium (Na) and titanium (Ti). Data acquisition is accomplished with a pulse processor/analogue-to-digital converter. Elemental composition is identified with digital filter background removal, least squares empirical peak deconvolution, gross peak intensities and net peak intensities above background. X-ra stability is 0.25% over any 8 hour period.
To the Quant'X technical specs here
TRACE ELEMENT ANALYSES
For Ti-Nb, Pb, Th elements the mid-Zb condition is used operating the x-ray tube at 30 kV, using a 0.06 mm (medium) Pd primary beam filter in an air path at 100 seconds livetime using mainly a 8.8 mm collimator to generate x-ray intensity Ka1-line data for elements titanium (Ti), manganese (Mn), iron (as FeT), cobalt (Co), nickel (Ni), copper, (Cu), zinc, (Zn), gallium (Ga), rubidium (Rb), strontium (Sr), yttrium (Y), zirconium (Zr), niobium (Nb), and La1-line data for lead (Pb), and thorium (Th). Not all these elements are reported since their values in many volcanic rocks is very low. Trace element intensities were converted to concentration estimates by employing a least-squares calibration line ratioed to the Compton or Rayleigh background established for each element from the analysis of international rock standards certified by the National Institute of Standards and Technology (NIST), the US. Geological Survey (USGS), Canadian Centre for Mineral and Energy Technology, the Japanese Geological Survey, and the Centre de Recherches P�trographiques et G�ochimiques in France (Govindaraju 1994). Line fitting is linear (XML) for all elements but Fe where a derivative fitting is used to improve the fit for iron and thus for all the other elements. When barium (Ba) and cerium (Ce) data are acquired, the Rh tube is operated at 50 kV and 0.25-1.0 mA in an air path at 100 seconds livetime to generate x-ray intensity Ka1-line data, through a 0.630 mm Cu (thick) filter ratioed to a portion of the bremsstrahlung region (see Davis et al. 2011). Further details concerning the petrological choice of these elements in Southwest obsidians is available in Shackley (2005; also Mahood and Stimac 1991; Hughes and Smith 1993; Shackley et al. 2018). A suite of 17 specific standards used for the best fit regression calibration for elements Ti-Nb, Pb, Th, Ba, and Ce include G-2 (basalt), AGV-2 (andesite), SY-2 (syenite), BHVO-2 (hawaiite), STM-1 (syenite), QLO-1 (quartz latite), G-2 (granite), RGM-1 (obsidian), W-2 (diabase), BIR-1 (basalt), BCR-2 (basalt), TLM-1 (tonalite), SCO-1 (shale), NOD-A-1 (manganese), NOD-P-1 (manganese) all US Geological Survey standards, BE-N (basalt) from the Centre de Recherches P�trographiques et G�ochimiques in France, and JR-1 and JR-2 (obsidian) from the Geological Survey of Japan (Govindaraju 1994).
The data from the WinTrace� software are translated directly into Excel for Windows software for manipulation and on into SPSS ver 27 or JMP ver 17 for Windows for statistical analyses when necessary. In order to evaluate these quantitative determinations, machine data were compared to measurements of known standards during each run ≤19 (Table 1). An appropriate standard (i.e. RGM-1, BHVO-2, NBS-278, G-2, AGV-2) is analyzed during each sample run to check machine calibration. Other appropriate standards from the above list are used for other volcanic or plutonic rocks.
DETECTION LIMITS
Detection limits for EDXRF have been calculated at 6σ here
"Matrix" issues in the analysis of standards: Recently, a number of scholars have questioned the validity of using pressed powder pellets of international standards for empirical calibration and data checking, called a "matrix issue" by some questioning the potential differing analytical results between pressed powder and whole rock samples (Jeff Ferguson, personal communication, 2010; cf. Shackley 2011a). This potential problem was tested in detail in Kathleen Davis et. al.'s (1998, reprinted 2011:45-64) study of EDXRF on obsidian and found to not be an issue (see also Shackley and Hampel 1992). Hermes and Ritchie (1997) derived similar conclusions using EDXRF with archaeological felsites. Table 1 exhibits the analysis of one of my pressed powder pellets of USGS RGM-1 and a flake from the same USGS collected boulder sent by Steve Wilson of the USGS. As one can see, the variability is within 1% or less in most cases, and some of this variability is inherent in the native variability within the single 200 kg boulder collected at Glass Mountain, Medicine Lake volcanic field northern California by USGS, not differing matrices. This issue is well examined by Ron Jenkins and seems to be misunderstood in the discipline (c.f. Jenkins 1999:167-172). While it is true that his discussion hinges on the assumption of homogeneity, one must assume that for purposes of non-destructive EDXRF that pressed powder standards are heterogeneous while obsidian is homogeneous. This is, indeed, not the case for obsidian studies in general. Jenkins explains:
Primary absorption occurs because all atoms of the specimen matrix will absorb photons from the primary source. Since there is a competition for these primary photons by the atoms making up the specimen [pressed powder versus glass], the intensity/wavelength distribution of these photons available for the excitation of a given analyte element may be modified by other matrix effects (Jenkins 1999:168; emphasis mine).
In the case of pressed powder pellets, the "competition" involves air molecules locked in the powder matrix that is not analyzed in obsidian studies and of course not present in volcanic glass, particularly with XRF and ICP-MS. While it is true that the borate mix used in the pressed powder can yield some boron, this element is undetectable by XRF and so light (Z=5) as to not cause peak overlap, especially when using any tube filtering. Perhaps more important is the issue of infinite thickness, particularly when Z≥51 and high tube voltages are required. In this case, some of the x-rays are radiated through the sample, and ratioing to the Compton or bremsstrahlung regions can yield complex results, as can be seen in the Table below for Ba, and evidently a problem for other analysts as well as seen by the GeoRem values in Table 1. In this case, careful calibration can mitigate some of this error. Parenthetically, only recently have PXRF products been able to reach 50 kV in order to adequately move electrons out of orbit for those atoms Z≥51 (see Jenkins 1999:9-12).
As I've noted in print and in discussions with many of my colleagues, not using international standards severely hinders the potential for establishing validity in obsidian research - it is nearly impossible to compare results across laboratories (Shackley 2010, 2011a; Speakman and Shackley 2013). Using the "matrix" issue as an excuse is unacceptable and just spitting in the wind.
Table 1. X-ray fluorescence concentrations for selected trace elements of USGS RGM-1 pressed powder pellet (n=52 runs; 1/19/2023) on the Si/Li detector instrument, and whole rock flake from original USGS boulder (n=20 runs; 1/20/2023). � values represent first standard deviation computations for the group of measurements. All values are in parts per million (ppm) as reported in Govindaraju (1994), USGS, GeoRem, and this study. RGM-1 is a U.S. Geological Survey obsidian standard obtained from Glass Mountain, Medicine Lake Highlands Volcanic Field, northern California. Pressed powder and whole rock elemental analysis of USGS RGM-1 obsidian standard on the ThermoScientific Quant'X and USGS, Govindaraju (1994), and GeoRem recommended values.
| SAMPLE | Ti | Mn | Fe | Rb | Sr | Y | Zr | Nb | Ba | Ce | Pb | Th |
| RGM-1 (Govindaraju 1994) | 1600 | 279 | 12998 | 149 | 108 | 25 | 219 | 8.9 | 807 | 47 | 24 | 15.1 |
| RGM-1 (USGS recommended)1 | 1618�120 | 279�50 | 12998�210 | 150�8 | 110�10 | 252 | 220�20 | 8.9�0.6 | 810�46 | 47�4 | 24�3 | 15�1.3 |
| GeoRem values2 | 1510-1940 | 282 | 12788-14263 | 142-164 | 96.73-116 | 21.6-25.1 | 173-258 | 8.37-13 | 791-881 | 39.4-51.4 | 18-28.4 | 14-16.3 |
| RGM-1, pressed powder (this study, n=52) | 1596�49 | 285�13 | 12808�51 | 150�3 | 108�3 | 24�3 | 223�4 | 9�3 | 813�20 | 38�13 | 26�2.1 | 16�3 |
| RGM-1, flake from original USGS boulder (n=20) | 1608�41 | 288�10 | 12840�38 | 154�3 | 110�3 | 26�2 | 229�4 | 8�3 | 1107�16 | 58�16 | 18�2 | 16�5 |
1 Ti, Mn, Fe calculated to ppm from wt. percent from USGS data.
2 information value
nr=not reported; nm=not measured
Table 2. X-ray fluorescence concentrations for selected trace elements of NBS(SRM)-278 pressed powder pellet (n=35 runs; 1/21/23). � values represent first standard deviation computations for the group of measurements. All values are in parts per million (ppm) as reported in Govindaraju (1994). NIST, GeoRem and this study. SRM-278 is a National Institute of Standards and Technology obsidian standard obtained from Clear Lake, Newberry Crater, Oregon. This is a favored standard by Mike Glascok at Missouri University Research Reactor Facility when analyzing obsidian with NAA (Glascock 1991, and personal communication).
| SAMPLE | Ti | Mn | Fe | Rb | Sr | Y | Zr | Nb | Ba | Pb | Th |
| NIST SRM-278 (Govindaraju 1994) | 1469 | 403 | 14269 | 127.5 | 63.5 | 39 | 290 | 18 | 1140 | 16.4 | 12.4 |
| NIST SRM-278 (NIST recommended)1 | 1469�5 | 403�2 | 14269�140 | 127.5�0.3 | 63.5�0.1 | n.r. | n.r. | n.r. | 1140 | 16.4�0.2 | 12.4�0.3 |
| GeoRem values2 | 1170-1469 | 325.5-401 | 11710 - 149000 | 105 - 137 | 30.2 - 67 | 35 - 41 | 211.4 - 287 | 21.4 - 22 | 890 - 1072 | 15.45 - 17.2 | 11.76 - 13.3 |
| MURR-NAA (Glascock 1991) | 1420�70 | 401�26 | 14100�16 | 126�2 | 67�3 | nm | 272�31 | nm | 887�16 | 17 | 11.71�0.13 |
| SRM-278, pressed powder (this study, n=35) | 1550�49 | 364�11 | 14120�53 | 130�3 | 69�3 | 41�3 | 289�4 | 16�4 | 940�21 | 20�2 | 16�5 |
n.r. = not reported
nm=not measured
1 Ti, Mn, Fe calculated to ppm from wt. percent from NIST data.
2 GeoRem values are measurements and compilations from various instruments, NAA, XRF, ICP-MS, PIXE-PIGME
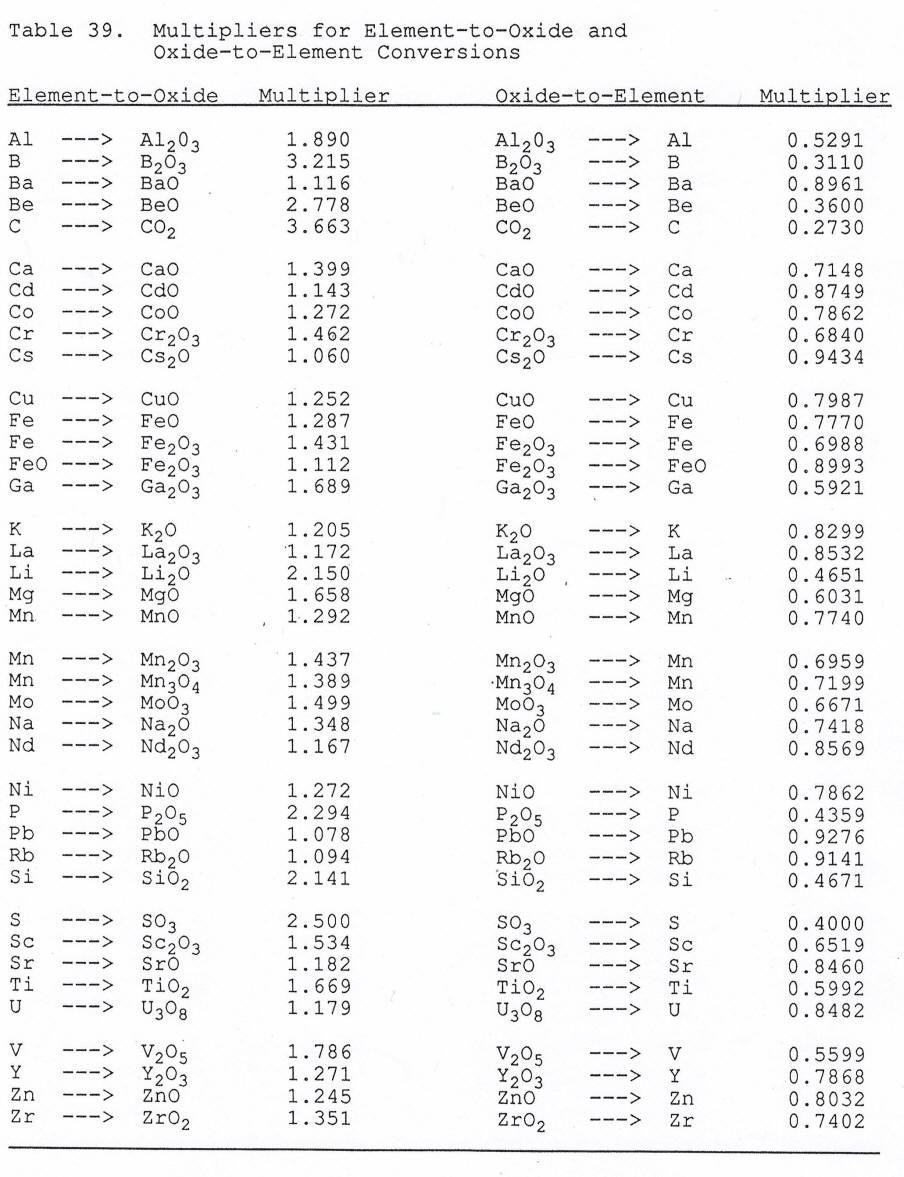
To MURR's oxide to element and element to oxide multiplier table (from Glascock 1991)
MAJOR OXIDE ANALYSES
Analysis of the major oxides of Si, Al, Ca, Fe, K, Mg, Mn, Na, and Ti is performed under the multiple conditions elucidated below. This fundamental parameter analysis (theoretical with standards), while not as accurate as destructive analyses (pressed powder and fusion disks) is usually within a few percent of actual, based on the analysis of USGS RGM-1 obsidian standard (see also Shackley 2011a). The fundamental parameters (theoretical) method is run under conditions commensurate with the elements of interest and calibrated with 3 USGS standards: AGV-2 (andesite), BHVO-2 (hawaiite), BIR-1 (basalt) all US Geological Survey standards, and Corning Glass Reference Glass D (Govindaraju 1994). See Lundblad et al. (2011) for another set of conditions and methods for oxide analyses.
CONDITIONS OF FUNDAMENTAL PARAMETER ANALYSIS1
Low Za (Na, Mg, Al, Si, P)
Voltage 6 kV Current Auto2
Livetime 100 seconds Counts Limit 0
Filter No Filter Atmosphere Vacuum
Maximum Energy 10 keV Count Rate Low
Low Zb (S, Cl, K, Ca)
Voltage 8 kV Current Auto
Livetime 100 seconds Counts Limit 0
Filter Cellulose (0.06 mm) Atmosphere Vacuum
Maximum Energy 10 keV Count Rate Low
Mid Zb (K, Ca, Ti, V, Cr, Mn, Fe)
Voltage 32 kV Current Auto
Livetime 100 seconds Counts Limit 0
Filter Pd (0.06 mm) Atmosphere Vacuum
Maximum Energy 40 keV Count Rate Medium
High Zb (Sn, Sb, Ba, Ag, Cd)
Voltage 50 kV Current Auto
Livetime 100 seconds Counts Limit 0
Filter Cu (0.559 mm) Atmosphere Vacuum
Maximum Energy 40 keV Count Rate High
1 Multiple conditions designed to ameliorate peak overlap identified with digital filter background removal, least squares empirical peak deconvolution, gross peak intensities and net peak intensities above background.
2 Current is set automatically based on the mass absorption coefficient.
X-ray fluorescence concentrations for selected major and minor oxides of USGS AGV-2 (andesite), RGM-1 (rhyolite), NBS-278 (rhyolite) pressed powder pellets, and RGM-1 flake from original USGS boulder, and recommended values (run 6/3/2024). All values are in weight percent (%) or ppm as reported in Govindaraju (1994) for NBS-278, USGS, and this study. RGM-1 is a U.S. Geological Survey obsidian (rhyolite) standard obtained from Glass Mountain, Medicine Lake Highlands Volcanic Field, northern California, AGV-2 is USGS andesite from the Guano Valley, Oregon, and NBS-278 is an obsidian (rhyolite) from Newberry Crater, Oregon. RGM-1 flake standard provides good elemental concentrations for the low and mid-Z elements, less so for the high-Z elements.
| SAMPLE | Na2O | MgO | Al2O3 | SiO2 | K2O | CaO | TiO2 | MnO | Fe2O3 | BaO |
| % | % | % | % | % | % | % | % | % | ppm | |
| AGV-2 | 4.34 | 1.92 | 16.53 | 61.41 | 2.73 | 5.11 | 0.94 | 0.10 | 6.38 | 1277.18 |
| AGV-2 REC | 4.20 | 1.80 | 17.03 | 59.14 | 2.90 | 5.15 | 1.05 | 0.10 | 6.78 | 1134.00 |
| RGM1-S5 | 4.08 | 0.03 | 13.42 | 74.30 | 4.43 | 1.20 | 0.25 | 0.04 | 2.01 | 812.07 |
| RGM-1 REC | 4.07 | 0.28 | 13.70 | 73.40 | 4.30 | 1.15 | 0.27 | 0.04 | 1.86 | 810.00 |
| NBS-278 | 4.78 | 0.00 | 13.75 | 73.50 | 4.26 | 0.97 | 0.23 | 0.05 | 2.21 | 961.03 |
| NBS-278 REC | 4.84 | 0.23 | 14.15 | 72.97 | 4.16 | 0.98 | 0.25 | 0.05 | 2.04 | 1140.00 |
| RGM-1 FLAKE | 4.24 | 0.11 | 13.47 | 74.76 | 4.08 | 1.07 | 0.24 | 0.03 | 1.73 | 1117.02 |
| RGM-1 REC | 4.07 | 0.28 | 13.70 | 73.40 | 4.30 | 1.15 | 0.27 | 0.04 | 1.86 | 810.00 |
METAL OXIDE ANALYSIS
Analysis of the major metal specific oxides of Mn, Fe, Co, Ni, Cu, Zn, As, Ag, Sn, Sb, Au, and Bi is performed under the multiple conditions elucidated below. This fundamental parameter analysis (theoretical with standards), while not as accurate as destructive analyses (polished metal disks) is usually within a percent of actual, based on the analysis of MBH bronze standards (see also Shackley 2011). The fundamental parameters (theoretical) method is run under two conditions commensurate with the elements of interest and calibrated with seven metal standards, and one gold ore standard: Cu pure, MBH bronze standards: 32XLB17A, 32XSN5B, 33XGM20A; USGS DGPM-1 gold ore standard, 2007 US Dollar, 2017 US Nickel, and 2019 US $5 Gold Eagle.
Conditions Of Fundamental Parameter Analysis1:
High Zb (Ag, Mo, Sn, Sb)
Voltage 50 kV Current Auto
Livetime 100 seconds Counts Limit 0
Filter Cu (0.559 mm) Atmosphere Air
Maximum Energy 40 keV Count Rate Medium
Mid Zb (Mn, Fe, Co, Ni, Cu, Zn, Au, Pb, Bi)
Voltage 30 kV Current Auto
Livetime 100 seconds Counts Limit 0
Filter Pd (0.06 mm) Atmosphere Air
Maximum Energy 40 keV Count Rate Medium
1 Multiple conditions designed to ameliorate peak overlap identified with digital filter background removal, least squares empirical peak deconvolution, gross peak intensities and net peak intensities above background. All measurements taken in an air path.
REFERENCES
Davis, M.K., T.L. Jackson, M.S. Shackley, T. Teague, and J. Hampel (new introduction by M.S. Shackley)
2011 Factors Affecting the Energy-Dispersive X-Ray Fluorescence (EDXRF) Analysis of Archaeological Obsidian. In In M.S. Shackley (Ed.) X-Ray Fluorescence Spectrometry (XRF) in Geoarchaeology, pp. 45-64. Springer Publishing, New York.
Glascock, M.D.
1991 Tables for Neutron Activation Analysis. 3rd edition. Research Reactor Facility, University of Missouri, Columbia.
Govindaraju, K.
1994 1994 Compilation of Working Values and Sample Description for 383 Geostandards. Geostandards Newsletter 18 (special issue).
Hampel, Joachim H.
1984 Technical Considerations in X-ray Fluorescence Analysis of Obsidian. In Obsidian Studies in the Great Basin, edited by R.E. Hughes, pp. 21-25. Contributions of the University of California Archaeological Research Facility 45. Berkeley.
Hughes, Richard E.
2010 Determining the Geologic Provenance of Tiny Obsidian Flakes in Archaeology Using Nondestructive EDXRF. American Laboratory 42:27�31.
Hermes, O.D., and D. Ritchie
1997 Nondestructive trace element analysis of archaeological felsite by energy-dispersive x-ray fluorescence spectroscopy. Geoarchaeology 12:31-40.
Jenkins, Ron
1999 X-Ray Fluoescence Spectrometry, 2nd edition. Wiley-Interscience, New York.
Jochum, K.P., U. Weis, B. Schwager, B. Stoll, S.A. Wilson, G.H. Haug, M.O. Andreae, and J. Enzweiler
2015 Reference Values Following ISO Guidelines for Frequently Requested Rock Reference Material. Geostandards and Geoanalytical Research 40:333-350.
Lundblad, S.P., P.R. Mills, A. Drake-Raue, and S.K. Kikiloi
2011 Non-destructive EDXRF Analyses of Archaeological Basalts. In In M.S. Shackley (Ed.) X-Ray Fluorescence Spectrometry (XRF) in Geoarchaeology, pp. 65-80. Springer Publishing, New York.
McCarthy, J.J., and F.H. Schamber
1981 Least-Squares Fit with Digital Filter: A Status Report. In Energy Dispersive X-ray Spectrometry, edited by K.F.J. Heinrich, D.E. Newbury, R.L. Myklebust, and C.E. Fiori, pp. 273-296. National Bureau of Standards Special Publication 604, Washington, D.C.
Schamber, F.H.
1977 A Modification of the Linear Least-Squares Fitting Method which Provides Continuum Suppression. In X-ray Fluorescence Analysis of Environmental Samples, edited by T.G. Dzubay, pp. 241-257. Ann Arbor Science Publishers.
Shackley, M. Steven
2005 Obsidian: Geology and Archaeology in the North American Southwest. University of Arizona Press, Tucson.
2010 Is there reliability and validity in portable x-ray fluorescence spectrometry (PXRF)? The SAA Archaeological Record, Nov. 2010, pp. 17-18&20.
2011a An introduction to X-ray fluorescence (XRF) analysis in archaeology. In M.S. Shackley (Ed.) X-Ray Fluorescence Spectrometry (XRF) in Geoarchaeology, pp. 7-44. Springer Publishing, New York .
2011b GLOSSARY. In M.S. Shackley (Ed.) X-Ray Fluorescence Spectrometry (XRF) in Geoarchaeology, pp. 207-226. Springer Publishing, New York.
Shackley, M.S. and Hampel, J.
1992 Surface effects in the energy-dispersive X-ray fluorescence (EDXRF) analysis of archaeological obsidian. Presented at the 28th International Symposium on Archaeometry, Los Angeles.
Shackley, M.S., L. Morgan, and D. Pyle
2018 Elemental, Isotopic, and Geochronological Variability in Mogollon-Datil Volcanic Province Archaeological Obsidian, Southwestern USA: Solving Issues of Intersource Discrimination.
Speakman, R.J., and M.S. Shackley
2013 Silo science and portable XRF in archaeology: a response to Frahm. Journal of Archaeological Science 40:1435-1443.
Revised:15 December 2025 15:13 -0700